Most Indian SaaS teams start with Google Analytics and a spreadsheet, and hit the same wall: they can see traffic, but not behaviour. How many people finished onboarding? Do trial users come back on day 7? Where in the flow do paying customers drop off? Those are product-analytics questions, and this is a practical guide to answering them without drowning in dashboards.
Product analytics vs web analytics
Web analytics (GA4) tells you where visitors come from and which pages they land on. Product analytics tells you what people do inside your product — the actions that lead to activation, retention and revenue. You usually want both, but if you're building SaaS, the product-behaviour half is where growth decisions actually get made. (More on the split in GA4 vs product analytics.)
What to track first
The mistake is tracking everything on day one. Start with the handful of events that map to your funnel:
- Signed up — the top of the funnel.
- Activated — the first moment of real value (e.g. "Created first project", "Sent first message"). Define this deliberately; it's the single most important event you'll track.
- Core action — the thing engaged users do repeatedly (e.g. "Ran report", "Published post").
- Upgraded / Paid — the conversion that matters.
Add properties that let you slice these later — plan, source, city, device — rather than inventing a new event for every variation. Name them in plain, consistent language (Signed up, not signup_evt_v2), because you'll live with these names for years.
The four reports that matter
Once those events flow in, four report types answer most questions:
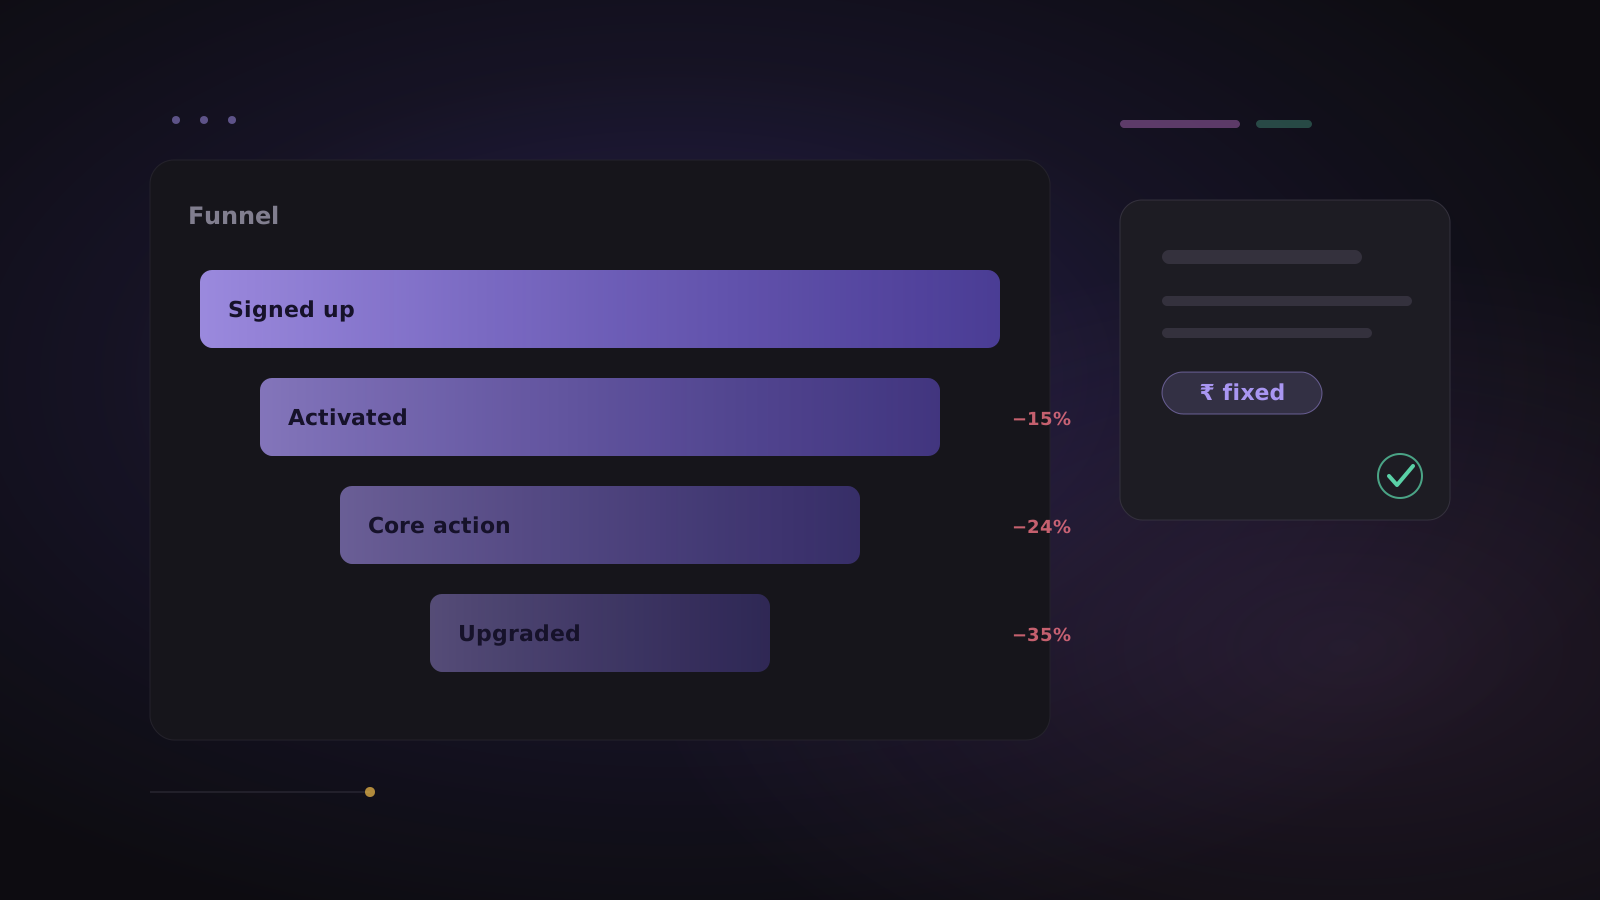
- Funnels — of the people who Signed up, how many Activated, then Upgraded? Where's the biggest drop?
- Retention — of the people who activated this week, how many came back next week? This is the truest measure of product-market fit.
- Trends (insights) — is your core action growing, and for which segment?
- Flows — what do people actually do between signup and activation? Often it's not the path you designed.
If a chart doesn't change a decision, it's a vanity metric. Total pageviews looks nice and tells you nothing; week-4 retention tells you whether to keep building or fix onboarding.
Things that matter specifically for Indian teams
- Identity across devices. People sign up on a laptop and use the app on a phone. If your tool counts browsers instead of people, every number is inflated. Make sure events get tied to a stable user ID after login.
- Data residency and privacy. India's DPDP Act means you should know what personal data your analytics stores. Prefer tools that don't retain raw IPs and let you delete a person's data on request.
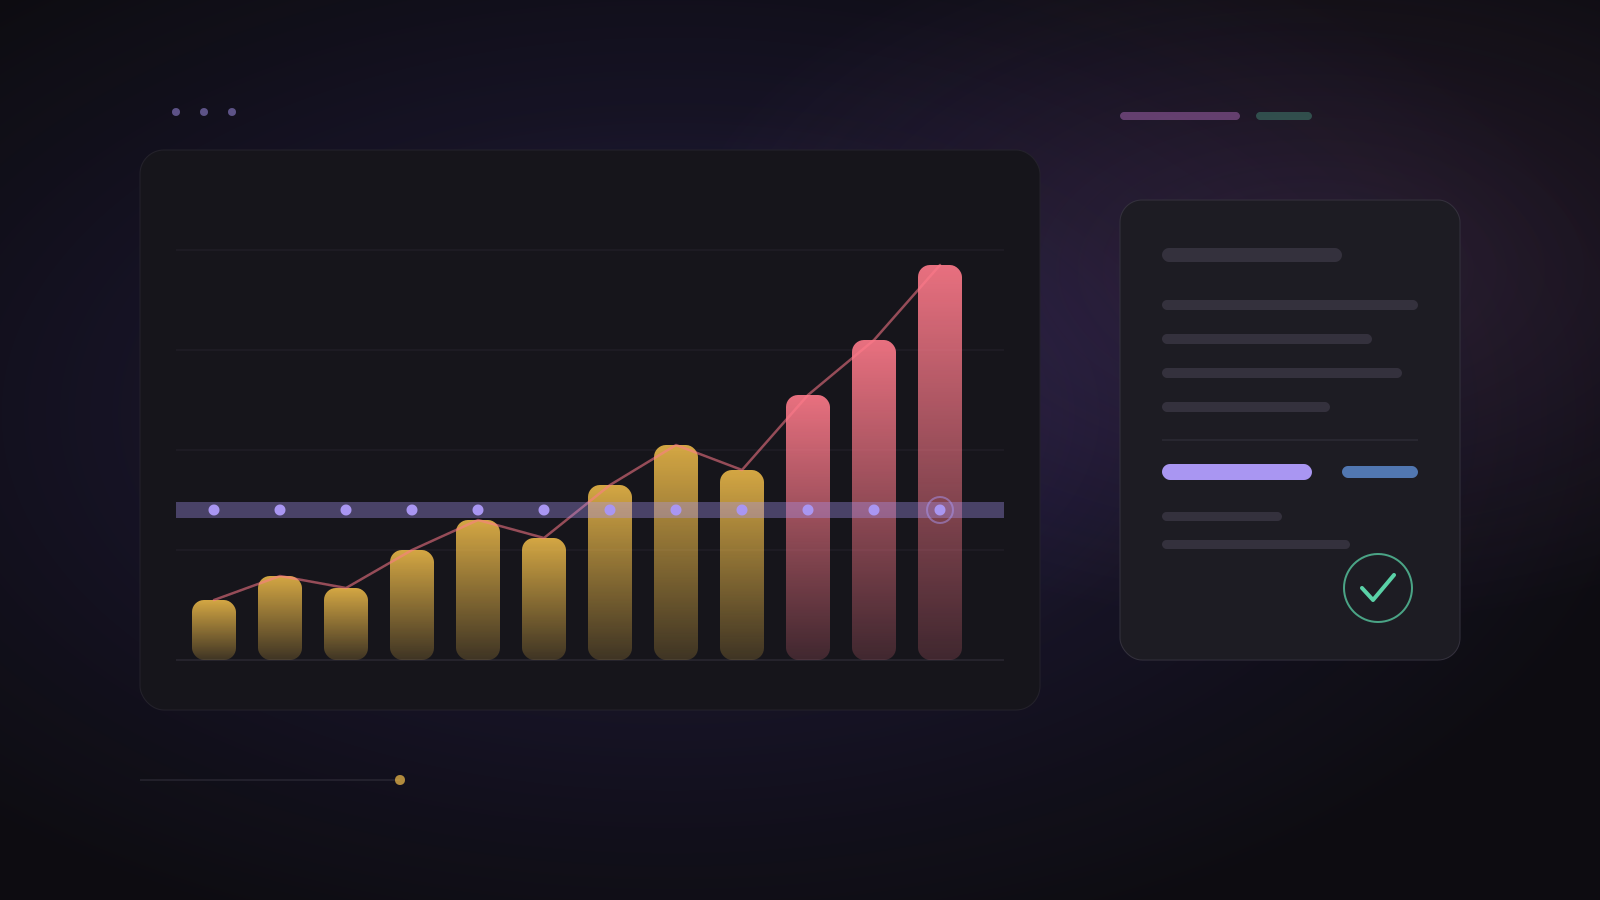
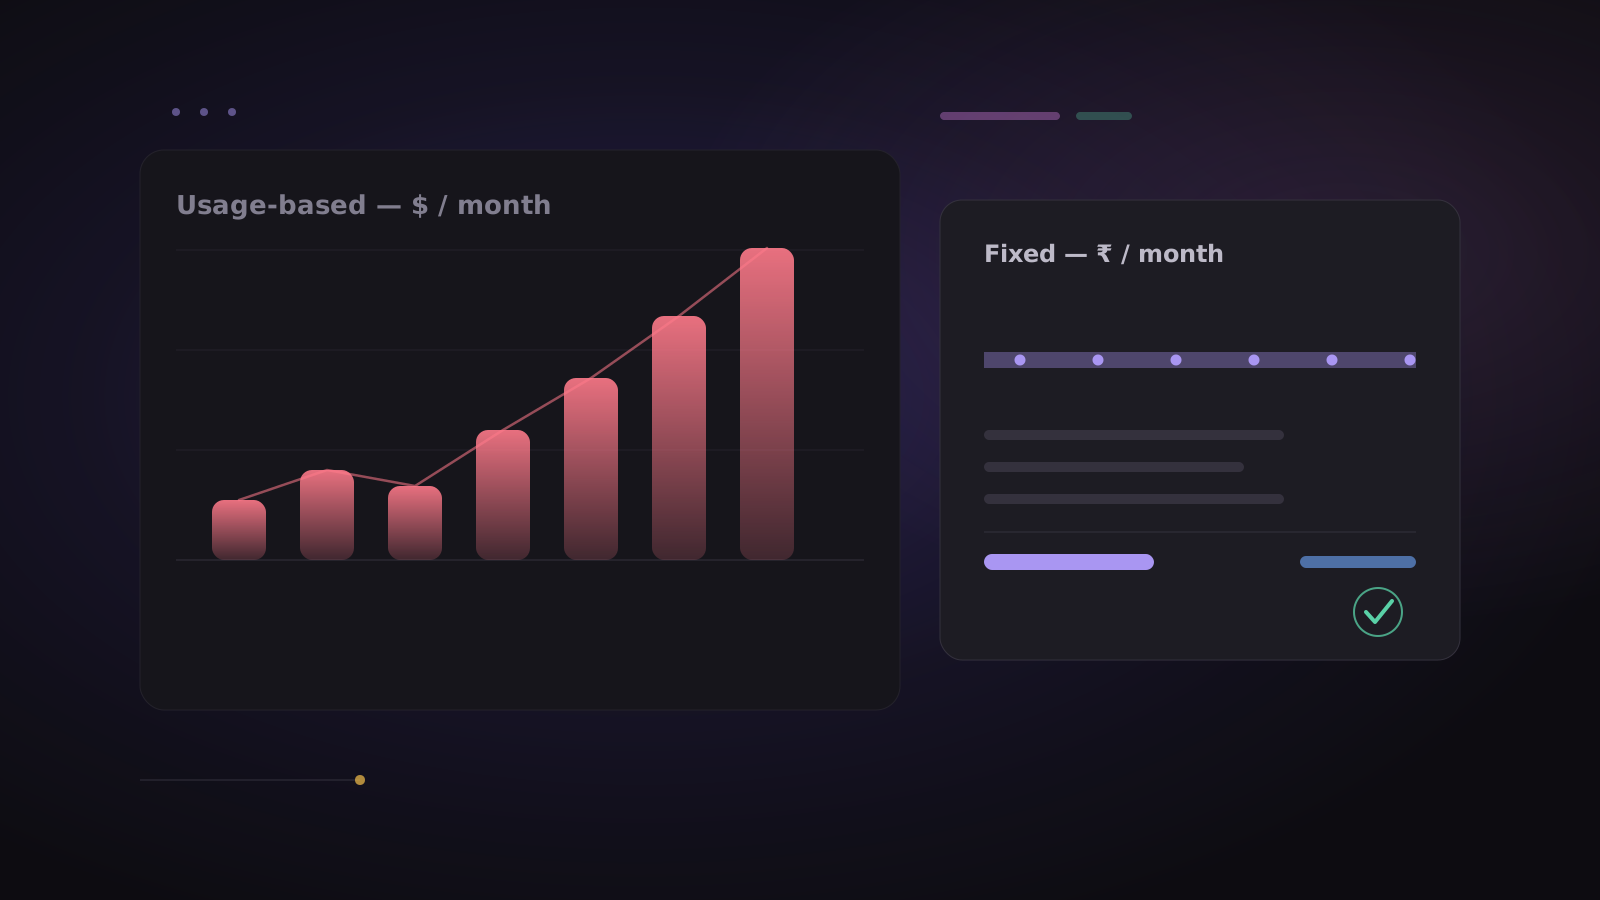
- A bill you can forecast — in rupees. Usage-based, dollar-billed tools make budgeting hard and add forex markup. Included-events pricing in INR, with a GST invoice, is far easier to plan around and to expense.
Choosing a tool
You don't need the biggest platform; you need one your whole team will actually open. Look for: the four reports above, identity resolution, plain-English querying for non-technical teammates, no per-seat pricing so you can invite everyone, and pricing you can budget.
ClickLens was built for exactly this: funnels, retention, user profiles, flows, boards and an AI analyst, with events included in every plan at a fixed price in rupees. See pricing, or if you're comparing options, Mixpanel alternatives in India and an Amplitude alternative for Indian teams.
Start free with 2 million events a month, no card needed, and start with just those first four events.